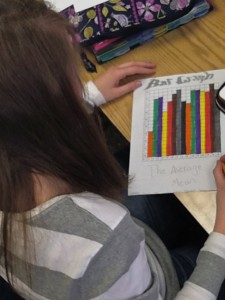
HeY GuYs! Thought I would tell you about what I am doing in school right now, my math class. Today we just started to work on graphs, why you might ask, and what about you might ask? Well I’m getting to it. 😀 We made this graph because, for our school we are going to make a muesum about Egypt. In order to make this musmum More enjoyable for the vistors that come (so its not borning) so we came to a 4th grade class and gave them a survey asking them what they liked about muemums and rate the certain catigories that are in mumeums (like if they like the videos, Robotic things, reading text, ect.) 1-10. It was a ton of fun, we got to present the sheet to them and everything! Then with all this important information, my group, which is Lindsey, Libby, Daniel, Mason and I worked on making graphs to represent these rating. We had to Make graphs my teacher said. So my teacher gave us all some different graphs and told us to make ways to use these graphs to present our information to the class. In this picture I am working on a bar graph about the mean of each of the questions. The mean is the average number in all the ratings. so yea, here it is. 🙂 it was really fun to figuer out! Hopefully the muemum will be more enjoyable now that we figured out what is more fun about the muemum the 4th grade people liked! That we can possible put into our muemum even!
Math Project
2

